About Me

My photo
NISM Certified Research Analyst & Mutual Fund Distributor.

Saturday 28 November 2015

Nifty Darling: Short Term Double Bottom?


The darling has been in a downtrend for the last few weeks. However this week it formed a bullish candle with lower shadow signalling supportive efforts at lower levels.

The darling formed a higher high and higher low as compared to previous week indicating positive bias. Besides it has managed to close above last week's high thus confirming the bullish double bottom in place at recent low of 7714.

On a daily chart too it has managed to close above 20 DMA. It seems that it has formed a strong base around 7800 levels during recent past. Technical Indicators too have turned bullish confirming the view of short term double bottom.

Our VIX & PCR reading too confirms the continuation of the current up trend.

In a nutshell as long as 7830 is not breached on a closing basis the view remains bias and we expect the Darling to kiss at least 8100-8150 levels in a short term

Sunday 19 July 2015

Nifty Darling


The darling didn't even touch 8315 levels discussed in previous post and took a sharp U-Turn and kissed 8600 mark. It has been trading above its short term moving averages as well as 200 DMA. Besides there is a cross over of 20 & 50 DMA which is quite a bullish signal. On a weekly chart too the momentum has started shifting and the darling is showing signs of steady recovery. The only weekly resistance is placed around 8660-8672 zone which once captured on closing basis we expect 8800-8850 levels quickly.

As per Options data 8500 PE is having highest OI suggesting strong base 8500 level. VIX is trading in very comfort zone around 13-15 mark. So the momentum is clearly in favor of bulls. At this point no short position is advisable.


Sunday 12 July 2015

Nifty Darling


In our previous post it was mentioned that weekly close above 8480 may add more fire however bulls failed to capitalize the move and the darling closed near its 20 WMA. On a daily chart the index has found support around 20 DMA however it has been closing below its 200 DMA for the last three sessions. Putting weekly and daily observations together it seems that the markets are trading in range of 8315-8500 in search of further directions. Short term Bias seems to be slightly bearish as long as 8480 is not captured on a closing basis. The bearish view will be reinforced once the darling closes below 8315.


Monday 6 July 2015

Nifty Darling- Finds Supports At 200 DMA What Next?


In previous post it was clearly mentioned that weekly close above 8480 levels may prove fatal for the bears and the darling may continue its northward journey intact. As expected the darling witnessed sharp recovery during intraday having opened gap down due to weak global clues. In today's session the darling found exact support at its 200 DMA and took U-Turn which is a clear signal by Bulls that they are in a no mood to weaken their grip. As per Fibonacci Retracement the darling found resistance around 50% placed around 8540 levels. Technically it is dancing above its short term moving averages and has also developed Falling Wedge Pattern on a daily chart which has already been discussed in earlier post. Besides other Technical Indicators are still in a quite bullish territory and VIX closed in red and still in a comfort zone around 16 levels so 8672 levels can be expected in a short term where the Golden Ratio is placed.

So the view is clearly in favor of the bulls and as long as 200 DMA is intact traders should utilize every dip as a buying opportunity. The simple strategy is to jump on the bandwagon rather than bucking the trend when the prices are trending higher. As long as 8380-8390 area is intact the darling may trade with positive bias in sessions ahead. Immediate support at 8480 while immediate resistance 8540.


Thursday 2 July 2015

Nifty Darling


In earlier post it was clearly mentioned that 8190-8220 area is the strong weekly support zone and as expected the darling took U turn from 8191 levels and reached the upper band in no time. For the last couple of sessions the darling is finding resistance around 8480 levels. On a daily chart the it is trading above its 20,50 & 200 DMA which is a positive sign. Besides it seems that the darling has formed Falling Wedge Chart Pattern on a daily chart which indicates the reversal of prior trend. Other indicators too on a daily chart have been the positive territory.

On a weekly chart the darling is hovering around its 20 WMA. During last week it witnessed a gap up opening on weekly chart and bulls have fully capitalize the move. Indicators on a weekly chart too are looking moderately bullish. VIX after kissing almost 19 mark has cooled down and trading in a comfort zone around 15.

In a nutshell the bias is clearly in favor of the Bulls as of now and weekly close above 8480 levels may add more fuel to the fire.


Sunday 28 June 2015

Nifty Darling


In earlier post of Nifty Expiry view expected that it may end up June series in the range of 8330-8340 and in line with the expectation the darling closed the series at 8381. June series witnessed quite a wild move as the darling showed a very sharp recovery from 7940 and finally closed the series at 8381. So again 7940-7960 areas has emerged as a very strong support for the Index.

Nifty has now captured its short term moving averages i.e 20 & 50 DMA and now dancing around its 200 DMA. In sessions ahead  a very tough fight for 200 DMA is expected between Bears and Bulls . On a daily chart 8425-8430 area  is the immediate resistance zone above which bulls are expected to have upper hand. On the other hand 8230-8210 area is the strong support zone for the Nifty. On a weekly chart the darling witnessed gap up opening and captured its 50 WMA and found resistance around its 20 WMA. Weekly close above 8475 may prove very dangerous for the bears above which 8630-8660 levels can be expected. 8190-8225 area is the strong support zone as far as weekly levels are concerned.

So as of now it is very difficult to form a very clear view on the darling. Traders can wait and watch for couple of sessions before trading any positional view on the darling.


Sunday 21 June 2015

Nifty Darling : Expiry View


In earlier post very boldly and loudly updated that any close above 8066 may lead to relief rally up to 8192 levels and the darling did all the TGTs on the upper side. During last session the darling witnessed gap up opening above its 20 DMA and managed to hold it on a closing basis which is a positive signal for the bulls at least for the short term. On a daily chart other Technical Indicators too have turned a quite bullish suggesting the short term uptrend. On a weekly chart the darling formed a strong Bullish Engulfing pattern. However it failed to capture its 50 WMA on a closing basis. On a weekly chart the Technical Indicators are still on a bearish zone.

As per Options Chain huge OI has been built up at 8400 & 8500 CE Strikes. At 8300 CE Strike total OI is 44.86 lac whereas OI at 8300 PE Strike is 18.24 lac. Heavy addition was seen at 8200 PE Strike whereas liquidation was witnessed at 8200 CE Strike. 8000 & 8100 PE Strikes have heavy OI. VIX closed down by almost 6%.

So at this juncture it seems that Nifty darling would now be entering multiple resistance zone. 8330-8340 zone may act as very stiff resistance on the upper side. On the downside 8160 may act as very strong support zone for the darling. Since we would be trading in expiry week expect Nifty darling to trade in the broader range of 8130-8330 with highly stock specific actions.

In light of the above view Traders can try Short Strangle Options Strategy.


Monday 15 June 2015

Nifty - Death Cross & RSI Bullish Divergence Analysis


As discussed in earlier post Nifty has been trying hard to bounce back but all attempts of bulls are going in vain and any bounce back is proving short lived. In Technical Parlance when 50 DMA moves below 200 DMA, such moving averages cross over is called Death Cross. As the name implies, a Death Cross is associated with sharp downward price movement and can be used as a sell signal in the belief that a significant downtrend will follow. However at the same time we can see the Bullish  Divergence of RSI on a daily chart. A bullish divergence occurs when the underlying security (Nifty) makes a lower low and RSI forms a higher low. RSI does not confirm the lower low and this shows strengthening momentum. Such Technical contradictions might create confusion for traders so an attempt has been made to give traders an idea as to how to take next move. 


So far we discussed Two Technical Factors viz. Death Cross & Bullish RSI Divergence. Now let's look at few other Technical factors to arrive at the final conclusion.


1. Nifty formed a Doji  Candle stick pattern on a daily chart during previous session and today managed to close above the same.


2. As per Options Chain 8000 PE is having slightly higher OI than 8000 CE Strike,  with liquidation seen at 8000 CE Strike.


3. Heavy OI built up at 7800 & 7900 PE Strikes suggesting strong base.


4. Heavy OI built up at 8200 & 8300 CE Strikes suggesting tough resistance zone.


5. VIX trading in the range of 15 to 18.


Conclusion : 


Considering the above picture it is quite evident that 7940 area has emerged as a strong support for the Nifty where demand comes in. So though there is a Death Cross as long as 7940 is not breached we may witness after shocks in term of minor pull backs in Nifty. On the other hand 8066 area is the stiff resistance zone where supply comes in and the darling starts reversal. Any close above 8066 and we may see a relief rally up to 8170-8192 levels in a short span of time. On the other hand close below 7940 will gave bears upper hand and the darling may commence its south ward journey and on the down side we may expect 7850-7830 levels in a short span of time.  

Thursday 11 June 2015

Nifty Trend Trading Product.


Dear Traders,

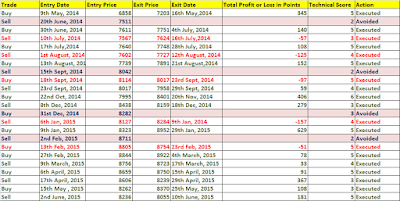
We have been providing only positional calls on Nifty under our "Nifty Trend Trading". Under the product we initiate Positional Short or Long on Nifty Darling based on definite rules. The exit whether to book profit or loss too is based on definite rules. The theme is 100% Technical with no subjectivity. Below is the result since May, 2014 to till date.


Total calls generated were 23 out of which 4 were avoided due to weak technical score. So total executed trades were 19 out which 5 Calls were negative whereas 14 calls were positive giving accuracy of almost 74%. Total Profit in points is 2489 which means profit of Rs.62225 assuming only one lot (25 Shares)  is traded at a time.

We will keep disclosing the result on a regular basis. The general important points about the product are as below.

1. Entry & Exit based on 100% Technical rules to avoid any subjectivity.

2. Ideal Capital requirement to trade only one lot is Rs.60000

3. Calls will be shared through SMS, What's up, Yahoo Messenger and G-Talk.

4. As per the system history hardly 2 or 3 calls are generated per month.

5. The product is available only in yearly mode & subscription charges are Rs.18000 only. 

6. Since the product is available at a very lucrative rate and requires very conservative amount of capital to trade even retail traders can go for it which is in line with our motto of empowering Retail Traders to earn money from markets irrespective of the direction of the markets.

For further doubt or any query mark a mail on info@moneymontra.in with subject line "Nifty Trend Trading". 


Nifty Darling Enters Crucial Support Zone


In our earlier post we tried to analyse the Nifty darling from different angels. As warned earlier the darling took no mercy again today and broke its earlier swing low of 7997 and kissed crucial support zone placed around 7960. Again we reiterate our bearish view on the darling as long as its is  dancing below  its 200 DMA which seems quite difficult to capture for the bulls. At this juncture any rally or any pull back may prove short lived and traders are again requested to resort to sell on rise strategy. We had also mentioned that such pessimism is the best time to enter select Blue chips like LT, ITC etc.. Traders can refer to our earlier post for further clarification.  


Wednesday 3 June 2015

Are We Heading Towards 7300?


Nifty darling witnessed steep decline on Tuesday after RBI took a cautious stance on the economic recovery even as it cut the policy rates by 25 basis points. Adding to pessimism, Indian 
Meteorological Dept. (IMD) latest report on monsoon indicates delay and downgrade in monsoon 
forecast, further dampened the sentiments. As a result, selling pressure was witnessed across the 
board even today and the darling gave two consecutive closes below 200 DMA. Even Pharma & IT which were coming to rescue the darling earlier are failing to provide support this time. 

Overall Technical Picture analysed from different perspective gives sign of horrible picture ahead. Let us discuss one by one.

1. Fibonacci Retracement Theory : - As per the Fibonacci Retracement & Extensions Theory  50, 61.8 or 78.6 retracement will often go to the 161 Fibonacci extension after breaking through the 0%-level. So as per the theory  7997 which was the swing low from where the darling retraced up to 61.8 level. Now if we believe the theory 161 Fibonacci Extension comes around 7300 levels provided 7997 is breached in a convincing manner. This is quite horrible, isn't it?


2. Chart Pattern Theory :-   

Nifty seems to have developed Head & Shoulder pattern on a daily chart. The Neckline Area is around 7960. So as per the  Head & Shoulder Chart Pattern Theory if 7960 is breached in a convincing manner the possible downside comes around 7200 level which again is quite horrible.


3. Moving Averages Theory :-  Among all the Moving Averages 200 DMA is considered to be of utmost importance. Above 200 DMA the Index or Stock is considered to be in the grip of Bulls. On the contrary below 200 DMA bears have the firm grips. Now as per the said logic Nifty seems to have breached 200 DMA in a quite convincing manner as today the darling witnessed huge volumes still failed to close above the same for the second consecutive day.


How to Trade in such bearish scenario?

1. Avoid Over leveraging.
2. Avoid high beta stocks.
3. Different Options Strategies like Buying ATM or ITM or Selling OTM Call Options can be tried.
4. Trade small position Size with strict Stop Loss.
5. Buying Blue-Chips stocks in installments as the time of maximum pessimism is the best time to enter such counters in a gradual manner.
6. Avoid carrying high leveraged position overnight. 


Sunday 17 May 2015

Nifty Darling


On a daily chart the darling has formed couple of Pin Bar Candlesticks and during last session it formed a doji Candlestick pattern. On a weekly chart bulls have been able to hold 50 Week Moving Average and two doji candlestick patterns are clearly visible. These candlestick formation on daily as well as weekly charts suggests that the Index is finding demand around 8160-8200 levels. 


As per Options data 8000 PE is having highest OI whereas 8400 CE is having highest OI. Total OI at 8300 CE strike is 38.88 lac whereas 8300 PE Strike is 30.04 lac. So we can expect tough fight for 8300 in sessions ahead. VIX trading around its resistance zone of 20 mark and with major data out expect it to further cool down.


Traders can initiate long position around 8200-8160 levels with SL of 8100 expecting to book profit around 8280-8335. On the other hand short position can be initiated around 8350-8380 with SL of 8430 for possibility of booking profit around 8230-8200 mark.